The Road to Root Cause
Have you ever received a call from someone that started with “Why is everything so slow”? I think it’s a safe assumption that everyone working in IT Operations has heard some variation of that question. The request could be anything from issue accessing Yahoo mail to a mission critical application unable to communicate with its database. The worst of these calls happen at 2am. Everyone is crabby, nobody wants to take blame or have a finger pointed at them, and there may not be solid supporting data showing slow down. The next day, everyone endures hours of root cause analysis. Unless the actual case is pinpointed you’re left with a time bomb, knowing that it’ll happen again.
A common troubleshooting issue during an investigation is a lack of unified metrics. Every business vertical has a dedicated monitoring tool, each of which present the data differently. The array shows IOPs but you need to go into the network monitor to see any performance data gathered through the switches. vRealize Operations had hundreds of data points but it may not always line up. There are also issues with tracking the applications inside VMs. You don’t have access to an in guest agent without vRealize Operations Enterprice. Sometimes it’s even hard to access tools depending on security restrictions. Lastly, there isn’t great visibility into the virtual switch on an ESXi host. It’s not easy to gather historic information regarding packet flow through these switches without actively running a packet capture via ESXCli. If the problem cleared up, that data is gone.
Uila aims to fill this gap. Their monitor, called Virtual Smart Tap, sits on each ESXi host. This allows the Management system to perform deep packet inspection on all packets that flow through virtual switches on the hosts. This is important in two key ways:
- First, it allows Uila to track network performance in a vSwitch. This is traditionally a blind spot between physical network monitors and virtual environment monitoring tools.
- Second, it performs an agentless auto-discover on the packet to identify the application on the VM and maps that to the upstream and downstream servers associated with that VM.
This data, combined with metrics gathered through vCenter server, is fed to a cloud management platform which summarizes it into a powerful dashboard that is easy to interpret.
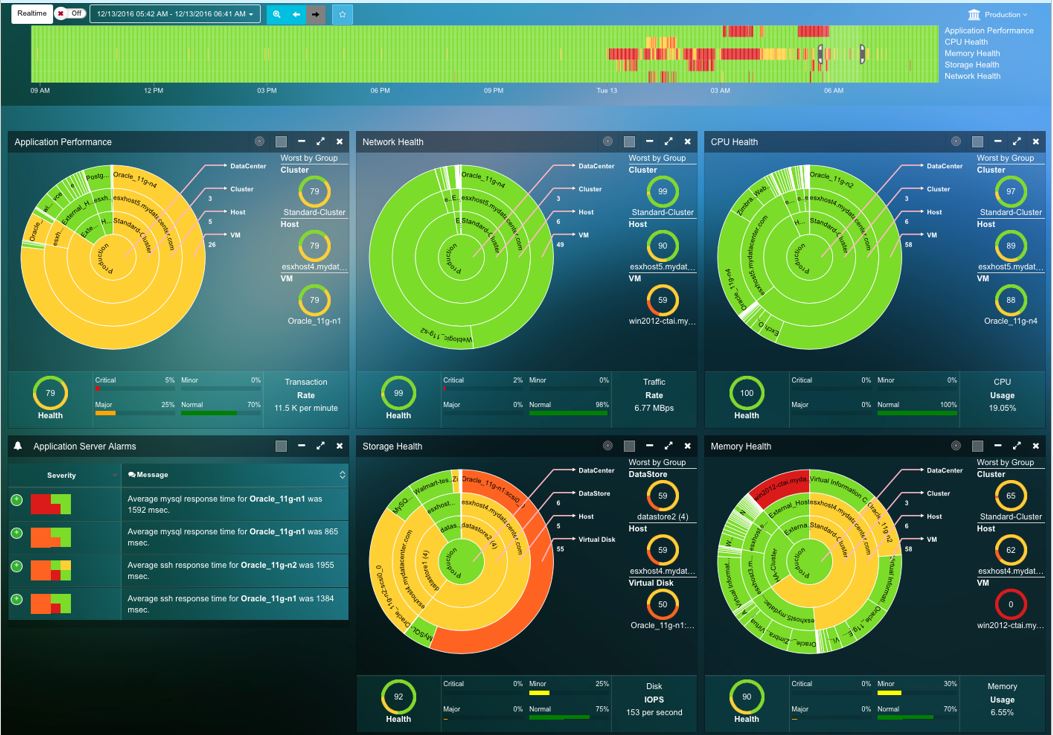
At the top there is a timeline which clearly identifies moments that Uila detected issues in red. There are multiple circles which show the resources consumed per resource type. Each ring of the circle expands toward the culprit using the most resources. The middle circle shows the datacenter, then cluster, host, and VM. The bigger the object, the more “interesting” the data gathered on the object. Clicking any item brings up a menu showing application response times, traffic, and health of the object. Clicking through to any item that is red will bring you to a deeper analysis that can estimate a root cause for the application issue.
It’s hard to use words to describe an interface so I encourage you to go to https://www.uila.com/online-demo/ and test out the demo yourself. You don’t need to sign up, just click the link and play in their online sandbox.To get started just move the time line picker at the top to a time with an alert. After that, click Application Analysis on the left. This opens up a view with all servers in the datacenter showing their performance and dependencies. The view can be a little messy but if you drag a red dot you can see the problem system and see which servers it is communicating with.
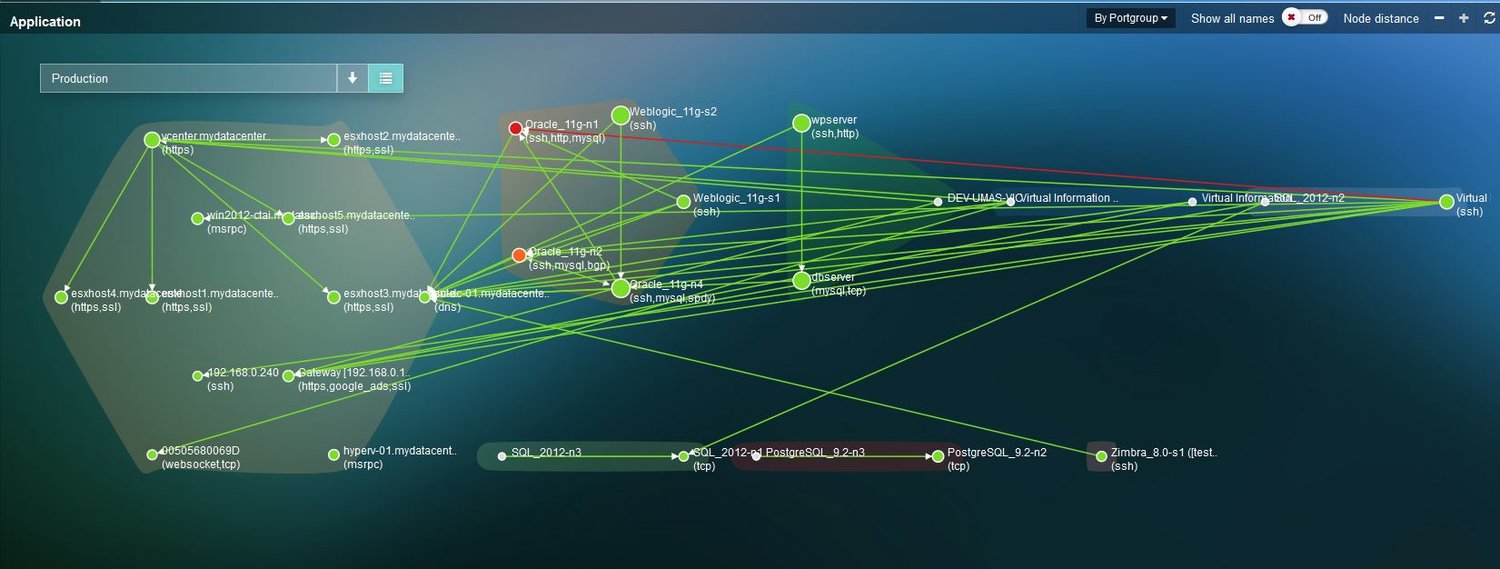
As I mentioned earlier, Uila uses deep packet inspection to make the associations. It can detect network transport issues on applications and show the servers that traffic pass between. Many organizations experience sprawl to the point where they can’t always maintain accurate application diagrams. Uila’s packet inspect can do this work for you. As a benefit you can see exactly which machines you need to consider if you’re migrating a workload to the cloud. The application analysis view can help ensure all required servers are migrated without forgetting one. It’s common to find VMs placed in the wrong folder or have unique naming conventions without clear documentation of its purpose. You wouldn’t have to say “So THAT is what Thor did” when migrating a previous engineer’s Norse pantheon of application servers.
I was impressed by the Uila demo during Tech Field Day. They have a noble goal to reduce the root cause problem to minutes and have a compelling tool that could accomplish it.