Application Discovery and Mapping with Uila
Uila is a platform that seeks to amplify visibility into a virtualized environment, allowing technicians to determine root cause for performance and availability issues. Increasing availability and determining root cause are critically important but are only one part of the Uila platform. The dashboard retains its familiar appearance, with its green/yellow/red application performance visualization but the software itself has many new features to explore.
Ulia has spent significant time and effort enhancing other features, in particular application mapping and documentation. The feature has always been a core tenant of the system but is now more simple than ever to consume. Anyone can generate an application map with a couple of clicks, displaying a view of a virtual machine and all other machines the server communicates with. As you plan a cloud migration, it’s important to understand how your applications operate with its dependencies. Without this knowledge, there could be too much traffic across a VPN or DirectConnect link, costing money and effecting application performance.
Application Dependency Mapping
All screenshots come from Uila’s interactive demo environment. Feel free to access it here and follow along.
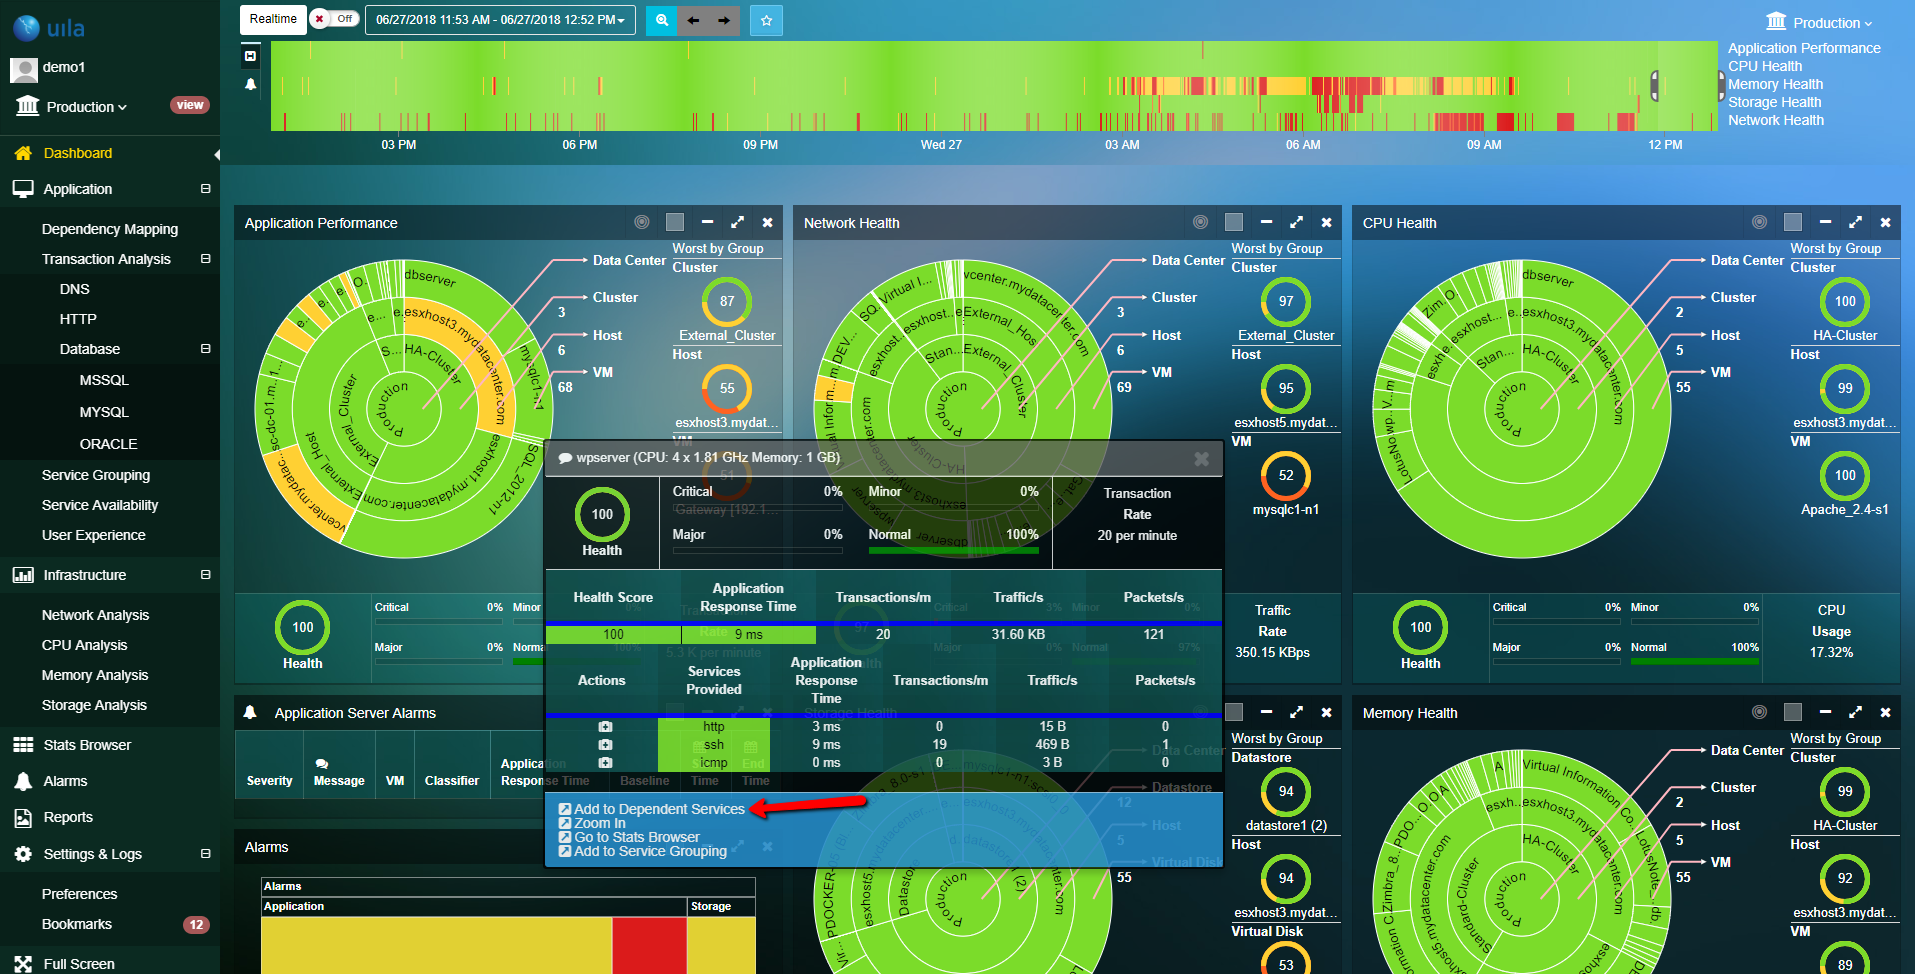
If you wish to create an application dependency mapping, click the VM’s name in the Application Performance widget. A box will open up with details about the health and communication history for the VM. Click Add to Dependent Services at the bottom of the box.
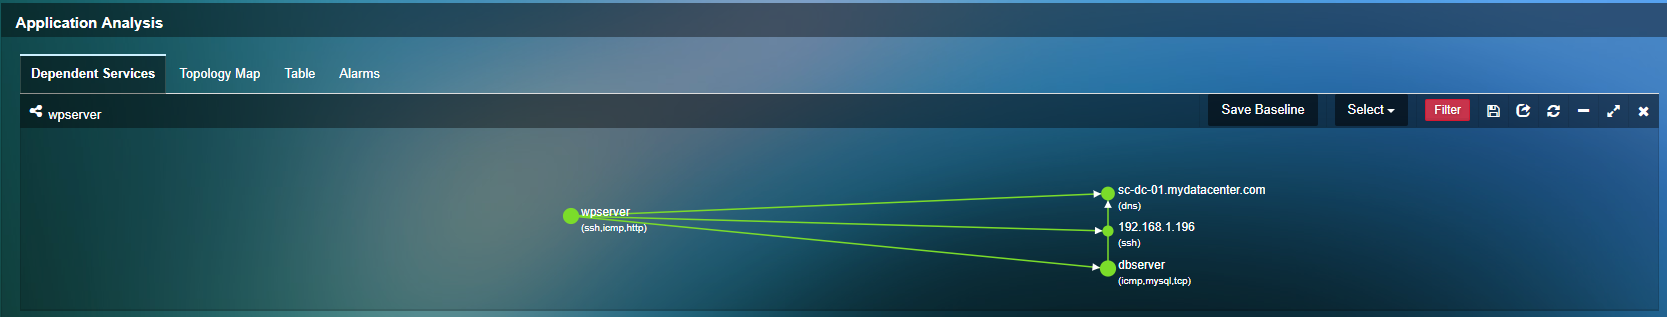
The screen will change to the Dependency Mapping view and the VM, along with its dependent systems, appear in an interactive diagram. This example shows a couple dependencies, though the diagrams can scale to dozens of nodes. The ability to drag items around the map can increase clarity in this view.
If we click the floppy disk icon to Export Application Map Uila exports a CSV file with a lot of useful details. All the information required to plan an application migration appears on the report, along with sizing information on the virtual machines.
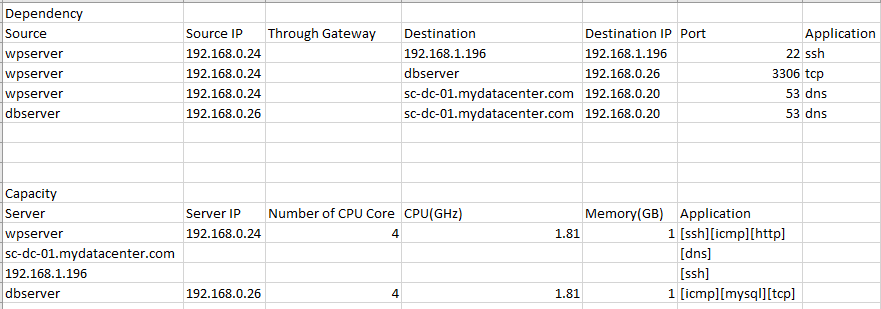
The report lays out information in a straightforward fashion, letting your networking and security teams view the traffic flow and plan accordingly. The data is collected in real-time, meaning the report can be gathered minutes after deploying the system, though the Uila team recommends letting it collect data for a week to make sure it captures everything.
Application Baselining
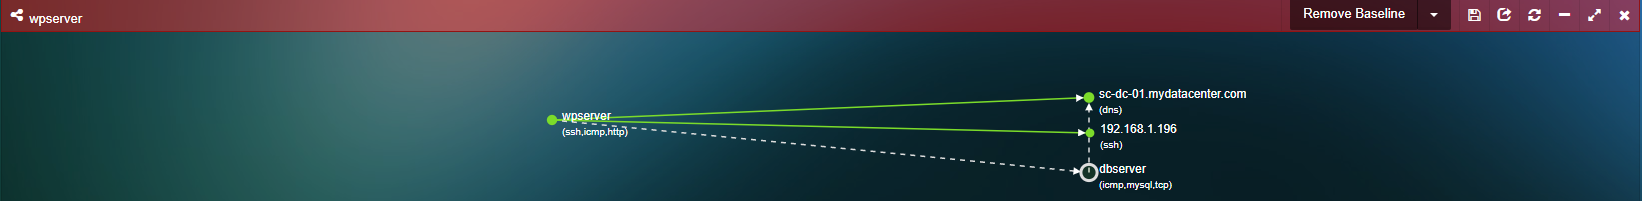
Another powerful Application Mapping feature is the Application Baseline. Continuing with the wpserver Application Map, click Save Baseline. The top bar will turn green, showing that the current state of the application matches the baseline. Now, drag the time slider at the top to somewhere in the red. It’s likely that at least one of the links in the application map will change. The connection between wpserver and dbserver has changed in my example. A dotted line means that the communication has stopped and a new dependency appears as a blue line. My favorite part is that the application map data is historical, so you can move the time picker to a time when an application was working, save the baseline, then move the time to a point where it isn’t working and see what changed.
Uila is one of my favorite monitoring tools. I first met Chia-Chee and Roger during Tech Field Day 13 and the tool has impressed me with each new update.