Uila 2.0 Hybrid Cloud Monitoring
On July 16, 2018, Uila released version 2.0 of its application monitoring and analytics platform. Previously we explored its application discovery and mapping features, focusing on resources that resided within an on-premises datacenter. As industry trends shift toward a hybrid cloud model many monitoring tools have a visibility gap. They only inspect data within their domains, creating a black hole between the on-premises datacenter and the cloud instances. Uila 2.0 seeks to fill that gap and provide real time visibility across any cloud.
Multi-Cloud Dependency Mapping
When applications span datacenter boundaries it can be challenging to monitor communication between individual servers. This blind spot is not only a potential security risk but communication between cloud environments and on-premises datacenters cost money. If you don’t know what data flows through those pipes you may be in for a surprise when the bill shows up at the end of the month.
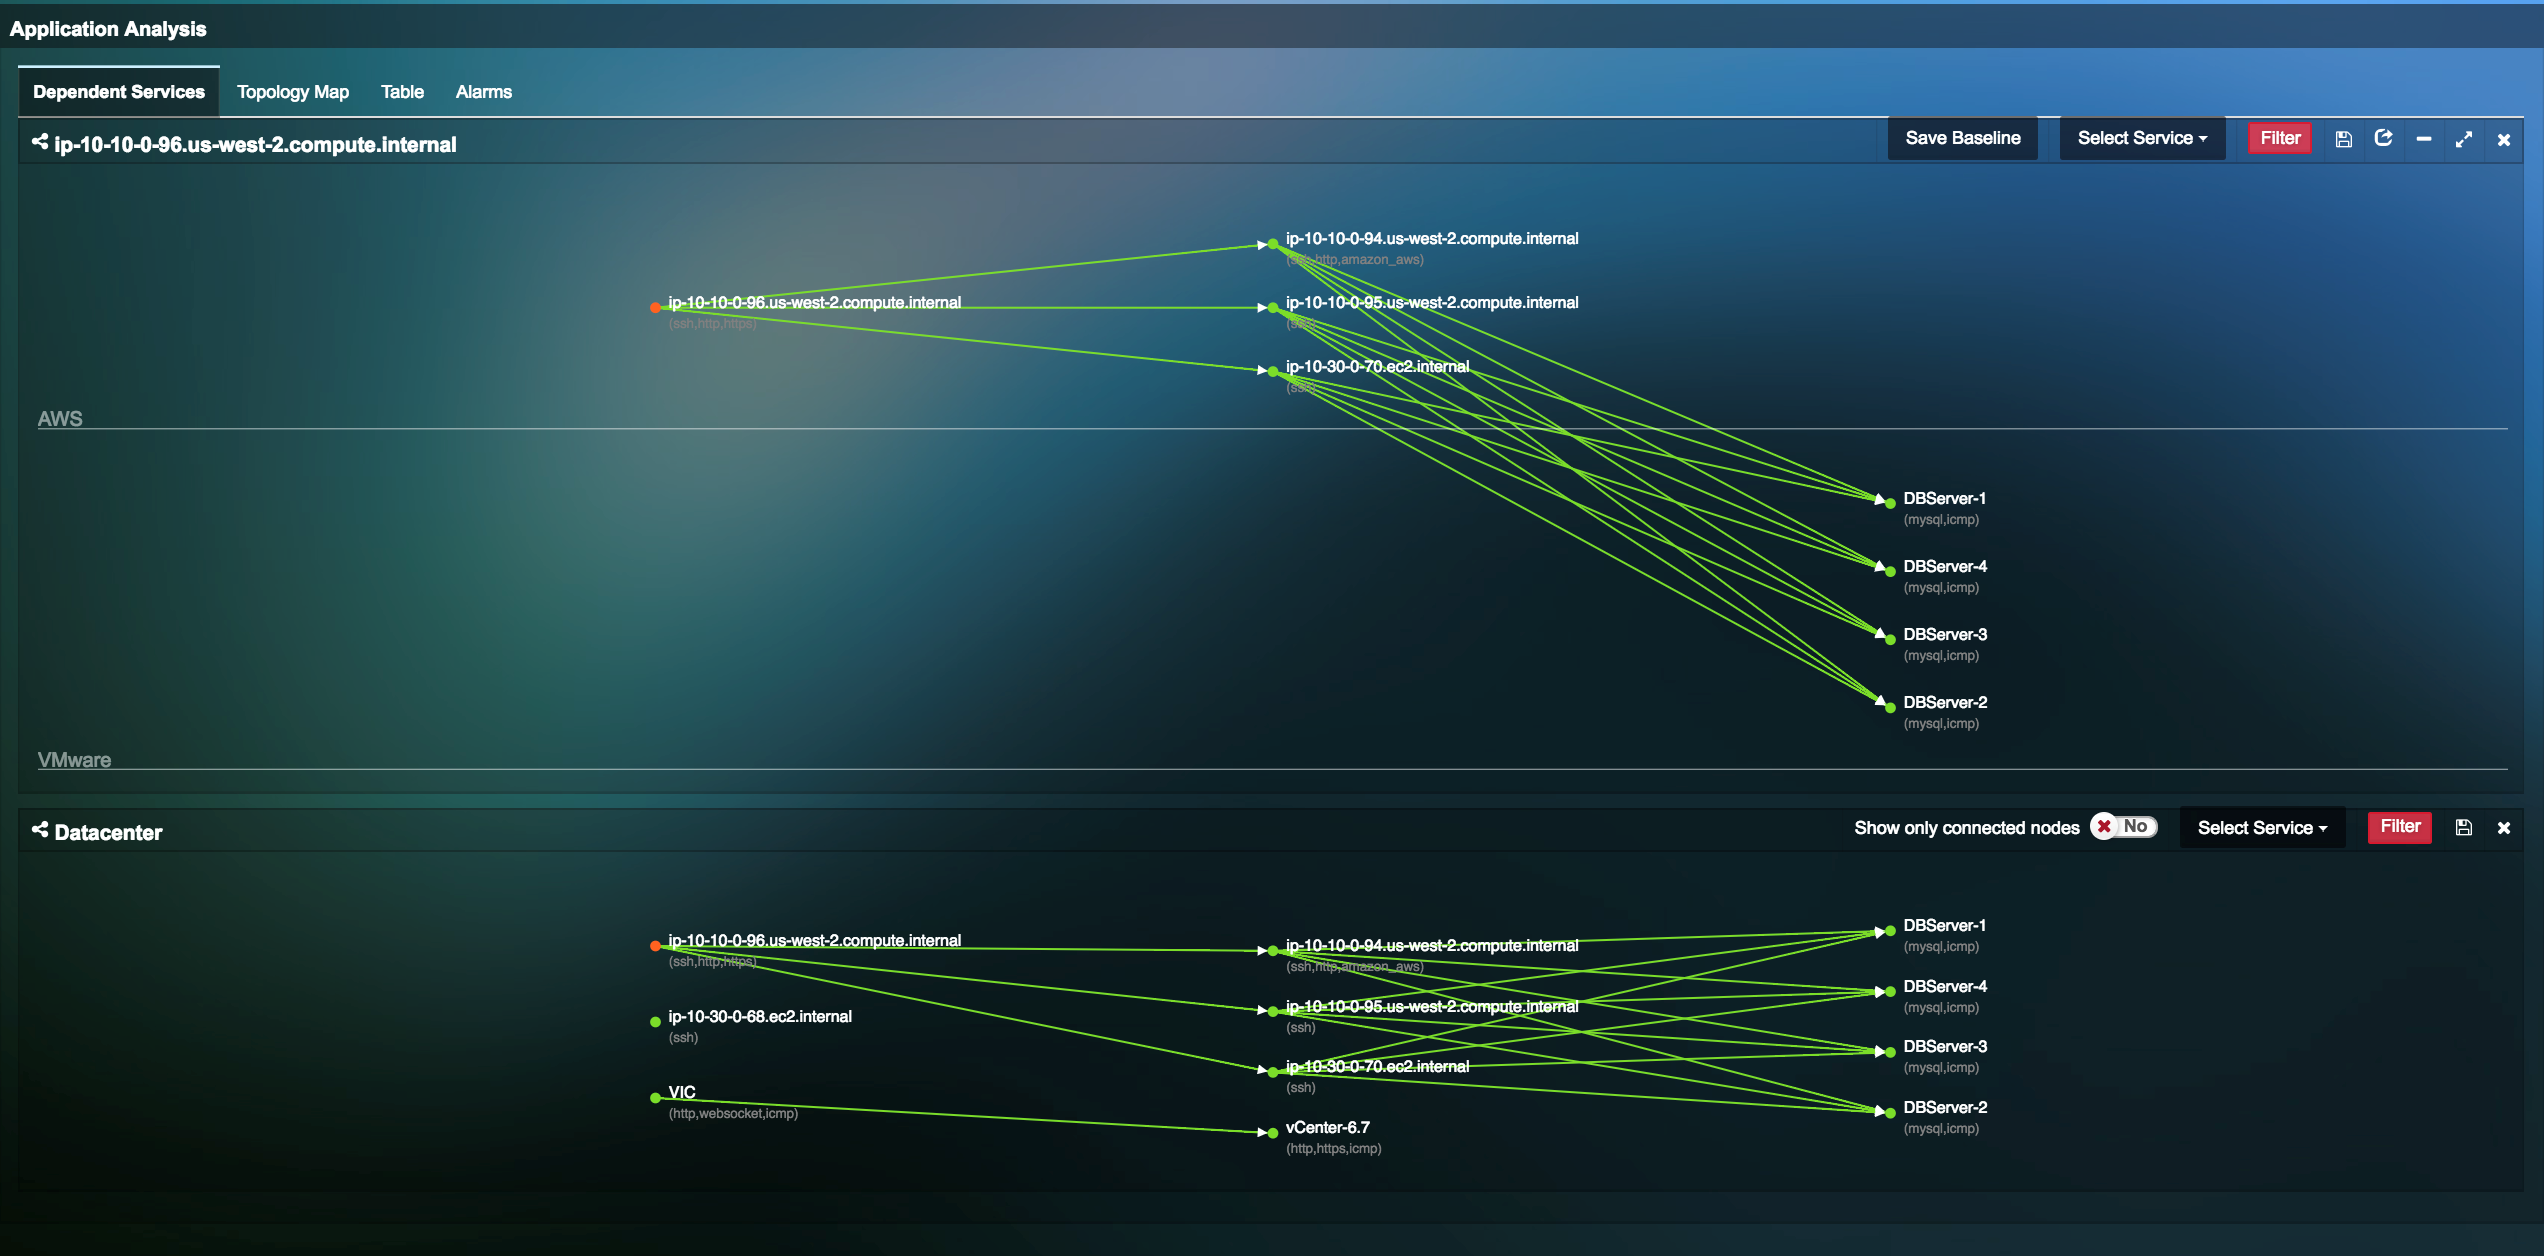
Uila’s application mapping has evolved to react to hybrid cloud architecture. The following diagram shows a hybrid cloud environment. Web servers are deployed as AWS instances and use in-house database servers and domain controllers.

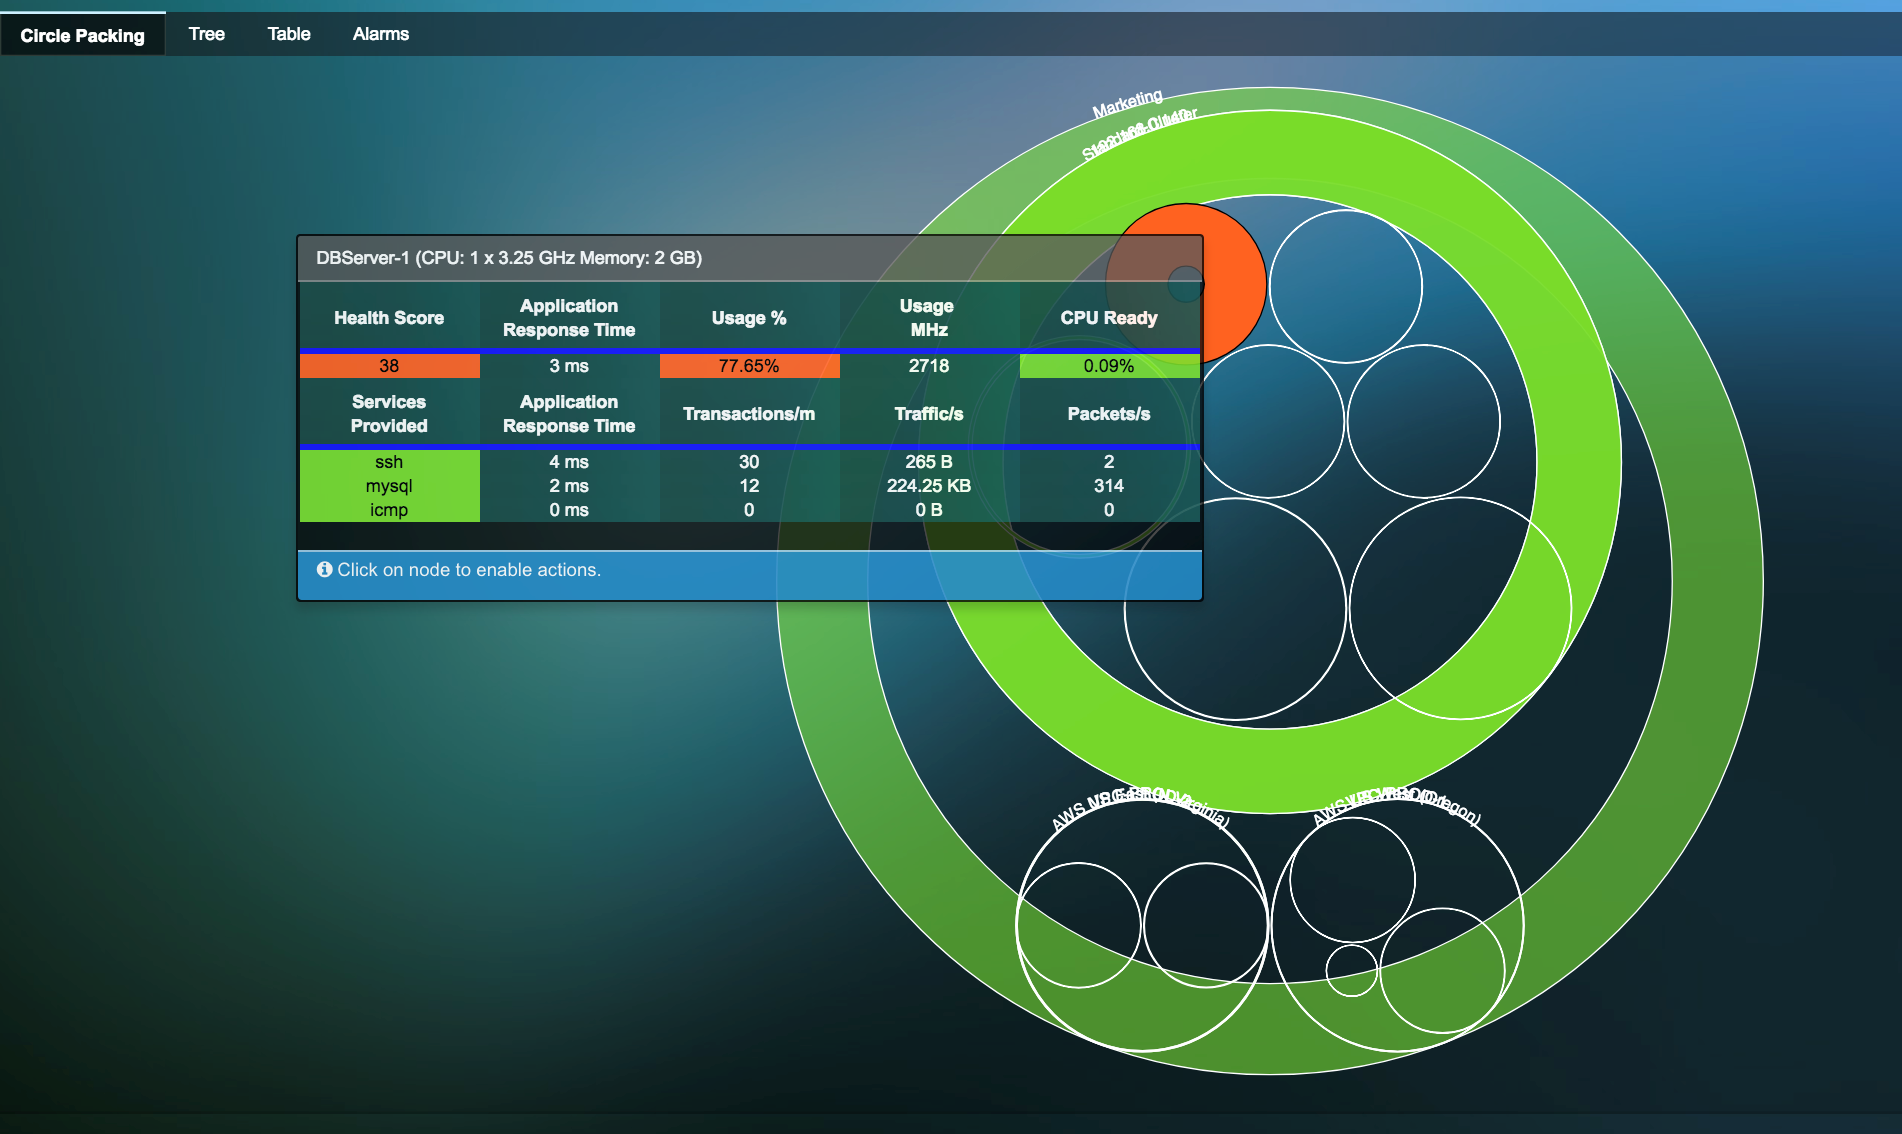
Quick, dynamic visualization of your dataflow can speed troubleshooting and help you track costs. Uila goes a step beyond this and provides a view to analyze resources within the application. The CPU Analysis view can show you color-coded visualization of CPU health. In this example, one of the database servers is undersized, which could lead to poor performance on the AWS web servers. The orange ring points out that its using 77% CPU, which is over the configurable threshold for usage in this case.

Resource Provisioning Recommendations
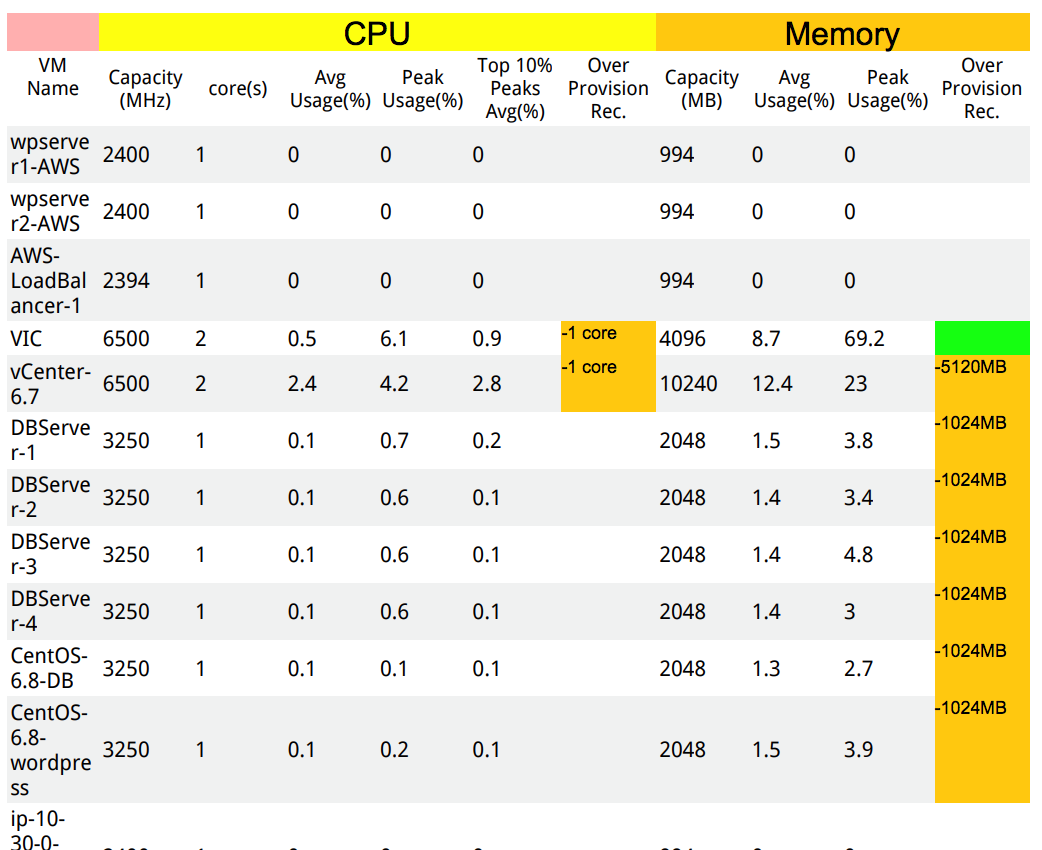
Exporting an application map has always been one of Uila’s most incredible features. Producing a spreadsheet of all application security settings with a single click is helpful and could save hours of a technician’s time as they plan a cloud migration. Uila 2.0 improves on this feature by adding a sizing recommendation section. In addition to having a CSV export with the source and destination traffic, the report gives a view of configured resources and resource utilization. A new column recommends sizing changes for overprovisioned VMs. Using this report can save your company money, letting you know exactly how many resources you need to provision in a cloud environment.

These features work together to highlight application performance issues and reduce excess cost in this new hybrid-cloud world. The new additions to an already impressive monitoring platform make Uila’s 2.0 release a multi-cloud monitoring powerhouse.
